
As we search for things to potentially keep us engaged in this 2018 Orioles debacle, we’re pretty much reduced to hoping to “win” the race for the number one draft pick, yes, but shouldn’t we also have some positive and/or interesting things to watch on a nightly basis NOW, as the team plays out the string?
There’s Cedric Mullins, who could very well be this team’s centerfielder of the future. There’s Renato Nunez, making a surprise case that he could be a cog in the rebuild. There could very soon be more call-ups from Norfolk and/or Bowie, like Austin Hays, D.J. Stewart, or others.
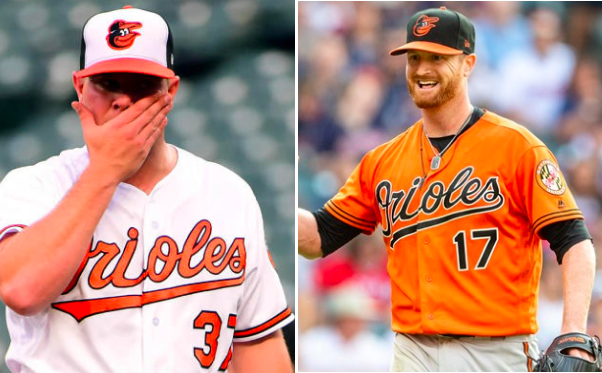
And what there should be, what we’d hoped to be able to count on, was that at least we can watch Dylan Bundy deal every fifth day.
Yeah, not so much.
Bundy has been abysmal over his last dozen or so starts, and things don’t appear to be likely to improve any time soon. On Wednesday in Toronto, he gave up seven runs for the third consecutive start.
Is that bad?
It’s more than a little distressing. Let’s try to see if we can figure anything out (because Dylan sure can’t, HEYO!)
Let’s first look at Dylan’s ERA by month in 2018:
April – 3.68
May – 6.12*
June – 1.98
July – 8.38
August – 9.74
May included the ridiculous clunker against the Kansas City Royals, when Bundy faced just seven batters, allowing five hits, two walks, and four home runs, for seven earned runs in 0.0 IP. We can give him a mulligan for that one – in that case, his May ERA drops to 4.18. Not great, but certainly more in line with April and June.
Since tossing eight scoreless against Boston on June 11, Bundy has just three quality starts in ten tries. In that same span, he’s allowed five or more runs six times, including seven in each of his last three starts. After that June 11 game, his season ERA stood at a very respectable 3.66. It’s now 5.31.
So what the heck is going on?
Perusing the data on BrooksBaseball.net and BaseballSavant.com, there are some potential indications, but nothing really jumps off the page. Let’s take a look, shall we?
The first thing I noticed was Bundy’s horizontal release point. Here it is by month in 2018.
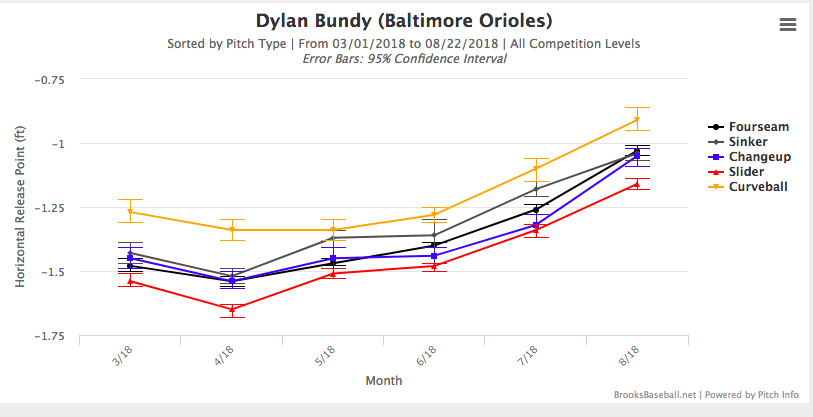
Based on this, one would assume Bundy has moved on the rubber. However, that doesn’t appear to be the case.
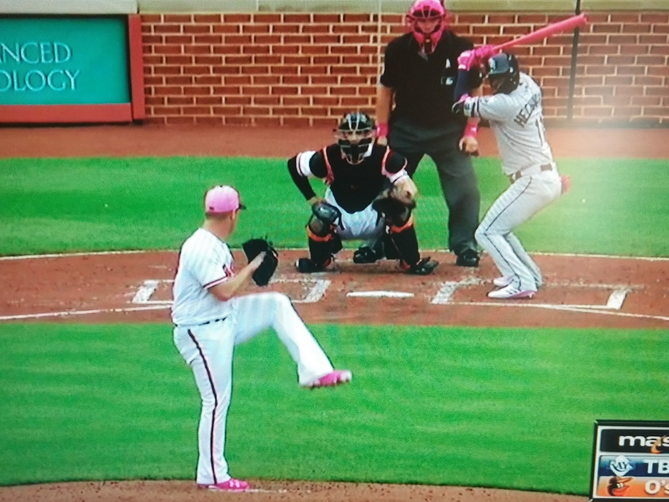
Here’s Dylan back on Mother’s Day:
And here’s Dylan last week against the Mets:
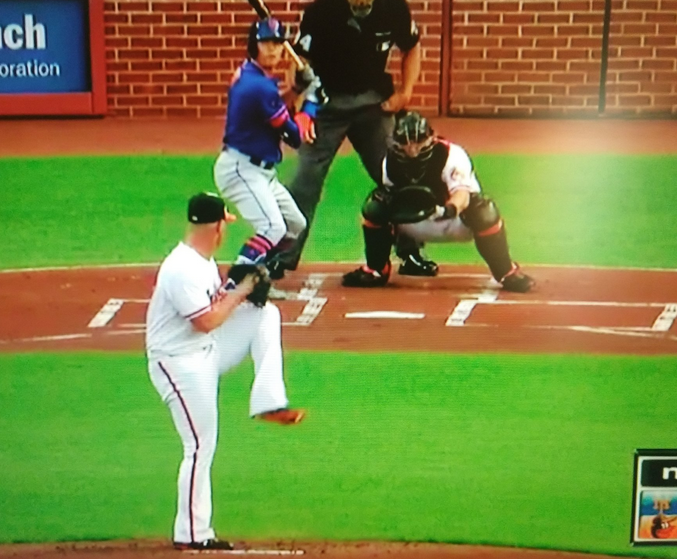
He certainly appears to be pitching from the first base side of the rubber in both instances.
So if he is standing in the same spot, why is his horizontal release point changing? Could a look at his vertical release point give us any further insight?
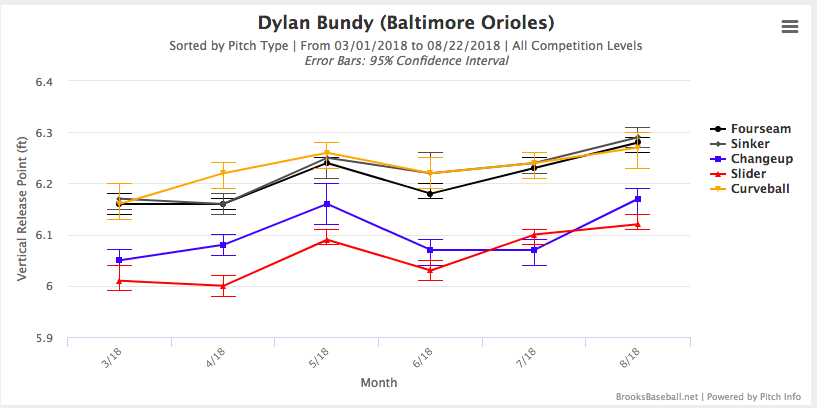
If anything, Bundy appears to be coming more over the top, as opposed to letting his arm leak out to the side, which we’d expect could be accounting for the change in horizontal release point.
I’m no doctor, but I did stay at a Holiday Inn Express last night, so I’ll offer one other potential explanation (I welcome yours as well):
Remember, Bundy injured his ankle running the bases in Atlanta in June. Since coming back from that, he’s turned in only two quality starts in eight tries. Perhaps his ankle is still bothering him, and it’s affected his push-off or his landing (I don’t know which ankle it was that he hurt – fill me in if you do).
I admit, I’m fishing for answers here (as I’m sure he and the coaches are). If you’ve any alternative theory for the change in horizontal release point, I’m all ears.
What about his velocity? Well…
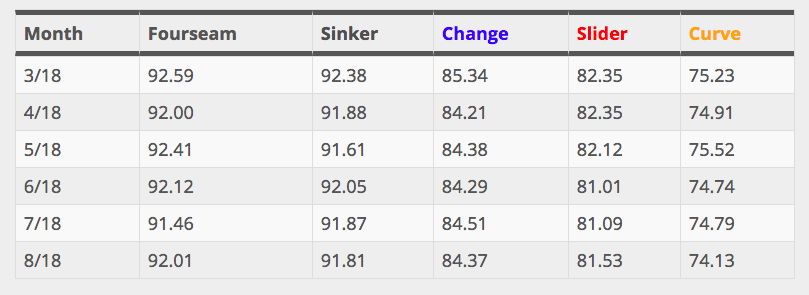
Anything jump out to you? The fastball dipped under 92 in July, but has creeped back above here in August. The change-up looks the same as it did in his very good April-May-June, as does the slider. The curveball has fluctuated a bit and is at a season-low in August.
Movement (vertical)?
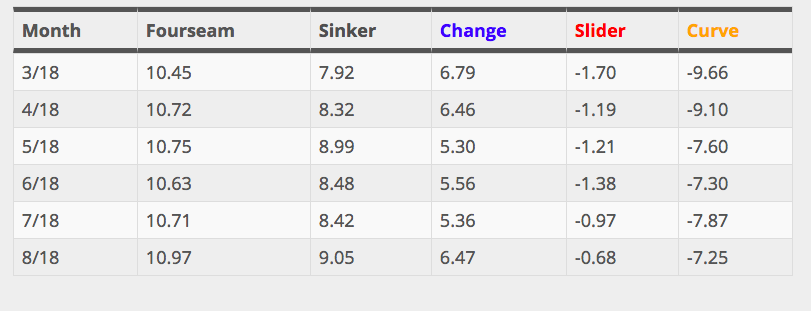
Now we may be getting somewhere. His slider and curve have stopped moving. The slider is dropping a half-inch or so less, while the curve has lost nearly two inches of movement since April (and half an inch since May).
How often is he using said pitches? Here are his pitch percentages:
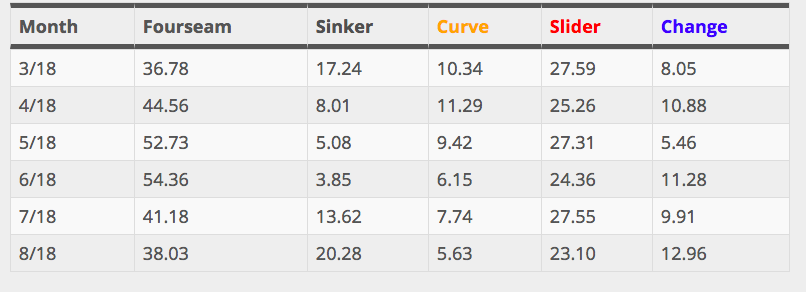
So Bundy is using his four-seamer, curve, and slider less (much less for the first two) than he was earlier in the year, and has made up for it with a lot more two-seamers and a couple more change-ups. He’s throwing over 20% two-seamers in August, up from 5% in May. Curious.
I also looked at some spin rates on BaseballSavant.com. I expected to find a significant dip to point at and say A-HA!, but I did not. I went through the trouble of doing this though, so you’re gonna look at this graph!

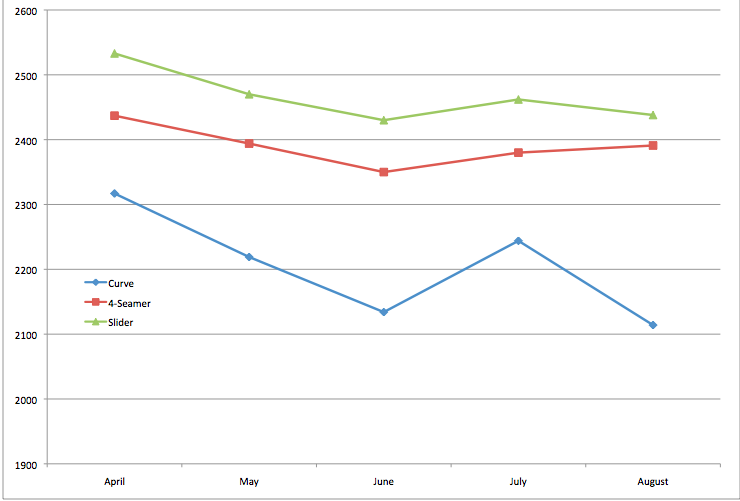
The spin rates on his four-seamer and slider were actually the lowest during his best month. So scratch that theory.
Maybe it really is just a location thing?
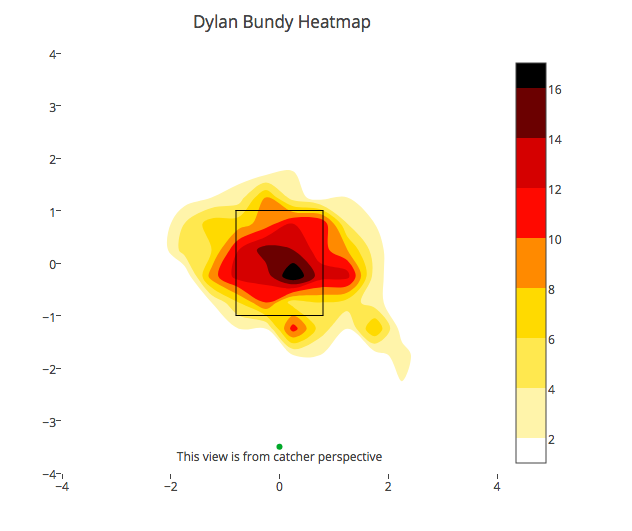
Here’s June for those three pitches:
And here’s August:
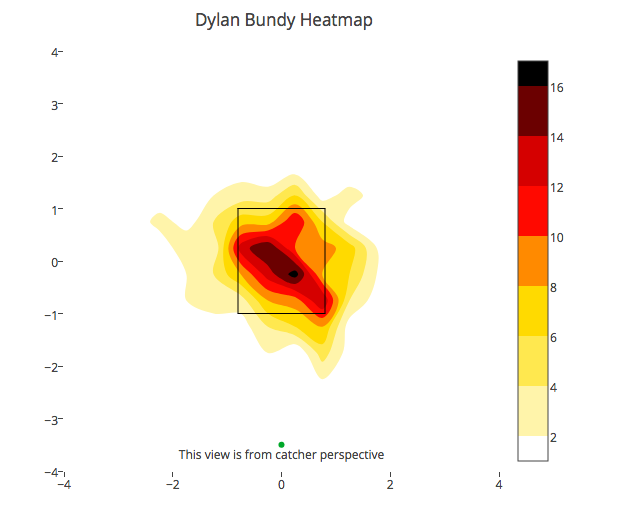
It certainly looks like Bundy was doing a better job keeping his pitches out of the middle of the plate in June, compared to this month. Just look at all the red toward and just outside of the edges of the zone in the first heat map, compared to the second, where pretty much all of the red is IN the zone.
So, that’s my investigation of nerd data on Dylan. To conclude: His pitch selection has changed markedly, and his horizontal release point is oddly floating, despite his appearing to still be pitching from the first-base side of the rubber. His spin rates don’t appear to be a concern, but his breaking pitches aren’t breaking nearly as much as they were, and his command is suffering as a result of…something.
If you have a subscription to The Athletic, it’s worth checking out this piece from friend of ESR Matt Kremnitzer. He wrote it back at the end of July, before things went even further off the rails for Bundy, but it’s still instructive.
Bundy insists he is healthy. Let’s hope, for our sakes and his, that he isn’t being totally honest in that assessment. I think it’s far past time to either shut him down for the season, or to at least start giving him 5-6 days off between starts (after all, that’s helped him in the past) to see if he can regain some effectiveness in this lost season’s final month. At this point, the only thing running him out there every fifth day guarantees is that the opposing team will score at least seven runs that day.
So that’s Dylan.
Let’s end on a bit of a positive note, shall we?
Alex Cobb is good again! Cobb’s ERA by month:
April – 13.11
May – 4.67
June – 6.67
July – 4.34
August – 1.55
What’s been so different for Cobb in August, when he’s allowed just five ER on 23 hits in 29.0 IP, with 19 strikeouts, five walks, and just three HR allowed over four starts?
Well, for one thing..
The Thing is officially back https://t.co/WylvrDP578
— Eno Sarris (@enosarris) August 19, 2018
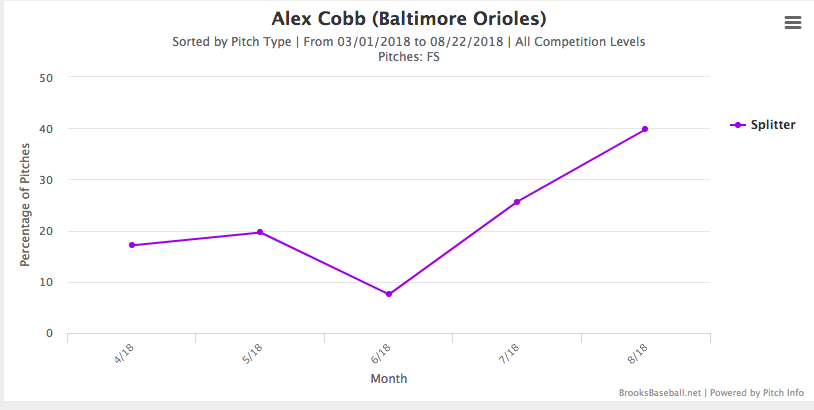
“The Thing,” of course, is Cobb’s split/change. He’s using it more…
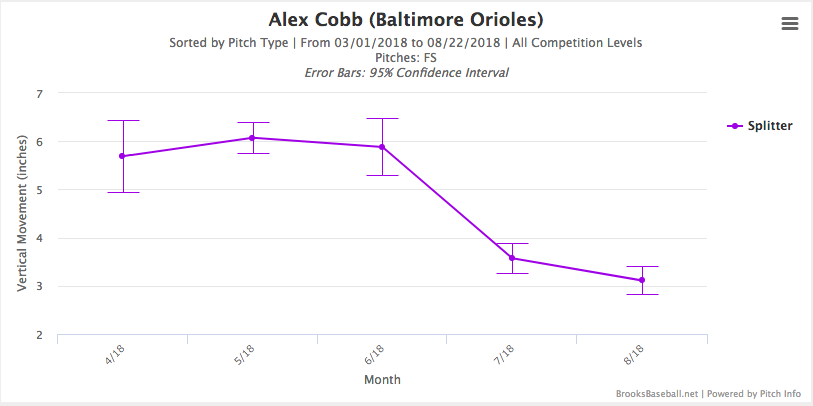
It’s breaking more…
And it’s getting a lot more whiffs!
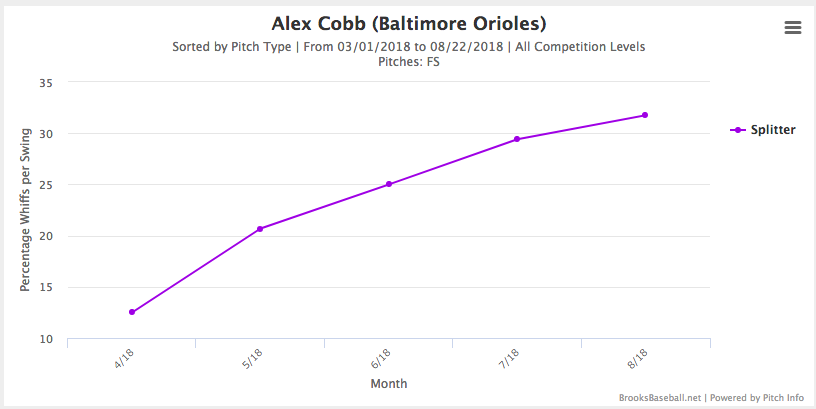
All great news. Hopefully it’s sustainable. This version of Cobb has plenty of value to the organization, whether they decide to keep him around or try to move him before his contract is up.
That’s our story of two Orioles pitchers, whose seasons have taken very different trajectories. One of them has gone from must-see TV to cringe-worthy, while the other has done the complete opposite.