Since the Statcast era began in 2015, “expected” statistics have grown every season in the weight they hold among talent evaluators as well as the number of fans using them. They’re a good tool to judge whether a slumping player is showing signs of breaking out, or if a hot start is bound to fizzle. A higher expected stat than actual result offers hope, while a lower expected stat can bring worry.
Statcast tracks three expected stats: expected batting average (xBA), expected slugging percentage (xSLG) and expected weighted on-base average (xwOBA). Using a batted ball’s exit velocity and launch angle, the program can determine how often that batted ball would likely fall for a hit, as well as how often that hit is a single, double and so on.
Looking at Orioles’ breakout star Cedric Mullins, his expected numbers are interesting to break down. Entering July 11th, Mullins ranked near the top of MLB in the difference between his BA and xBA, his SLG and xSLG and his wOBA and xwOBA.
.313 BA, .275 xBA –> .038 difference (12th largest)
.543 SLG, .445 xSLG –> .098 difference (4th largest)
.392 wOBA, .347 xwOBA –>.045 difference (7th largest)
So, the numbers suggest Mullins is over performing due to a little luck going his way and that he’s due to regress. Should this be cause for concern, or is it an example of how faulty and incomplete expected stats can be?
For this exercise, I’ll be taking the stance that Mullins is one of the exceptions rather than the rule for judging how the rest of a player’s season will turn out based on expected stats. To disprove that Mullins is due to regress based on these numbers, I’ll first take a look at who accompanies him near the top in difference between the expected and actual stats.
Typically, faster players sit near the top of these leaderboards. This should be common sense, as they are the ones hustling out infield singles, turning singles into doubles and doubles into triples. Mullins fits the mold here, coming in with a top sprint speed of 28.7 feet per second, ranking in the 90th percentile league wide.
This holds true for the rest of the list of guys around Mullins in largest difference between expected and results. Eight of the top 10 in xwOBA difference, nine of the top 10 in xSLG difference and six of the top 10 in xBA have at least 55th percentile sprint speeds.
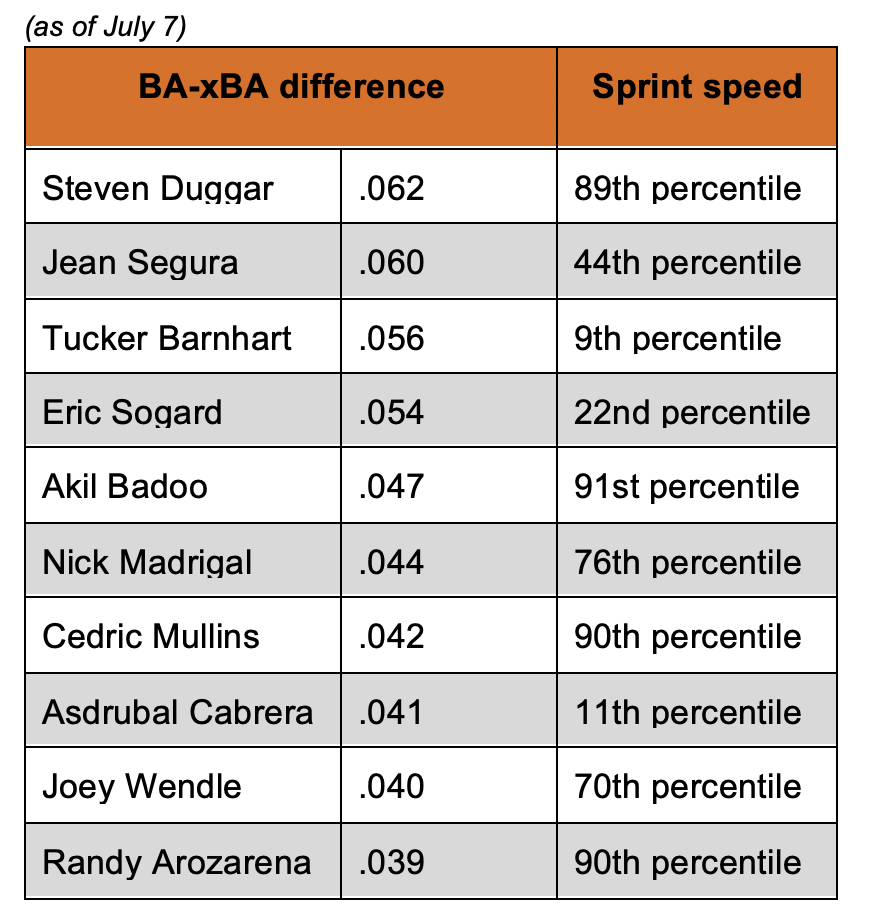
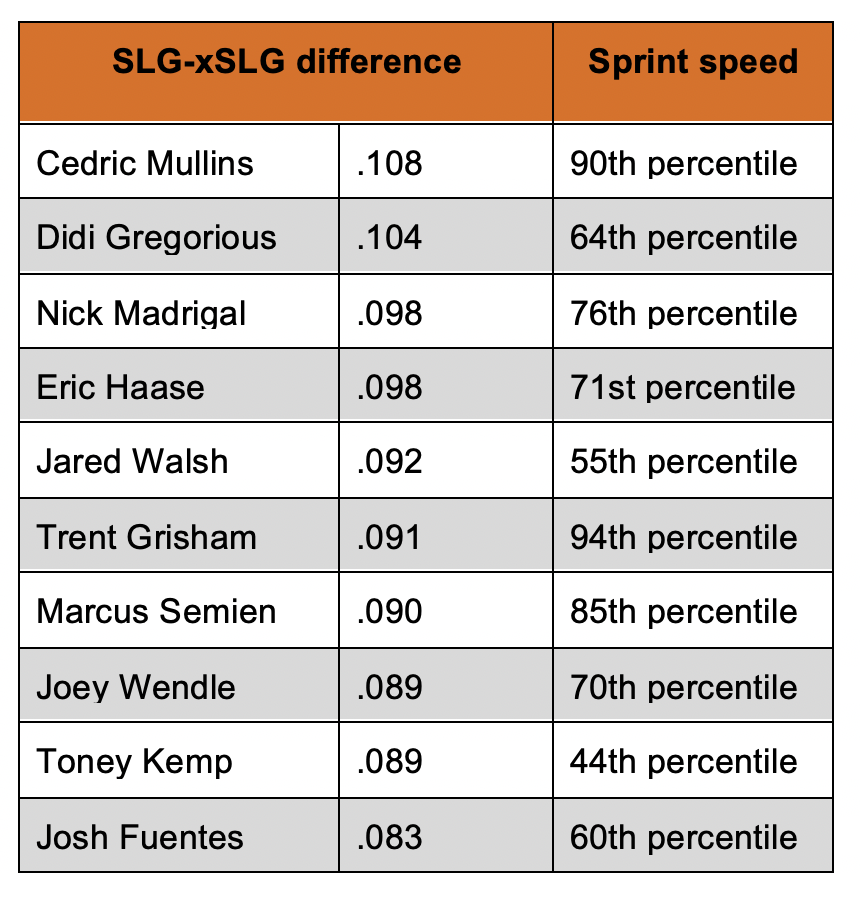
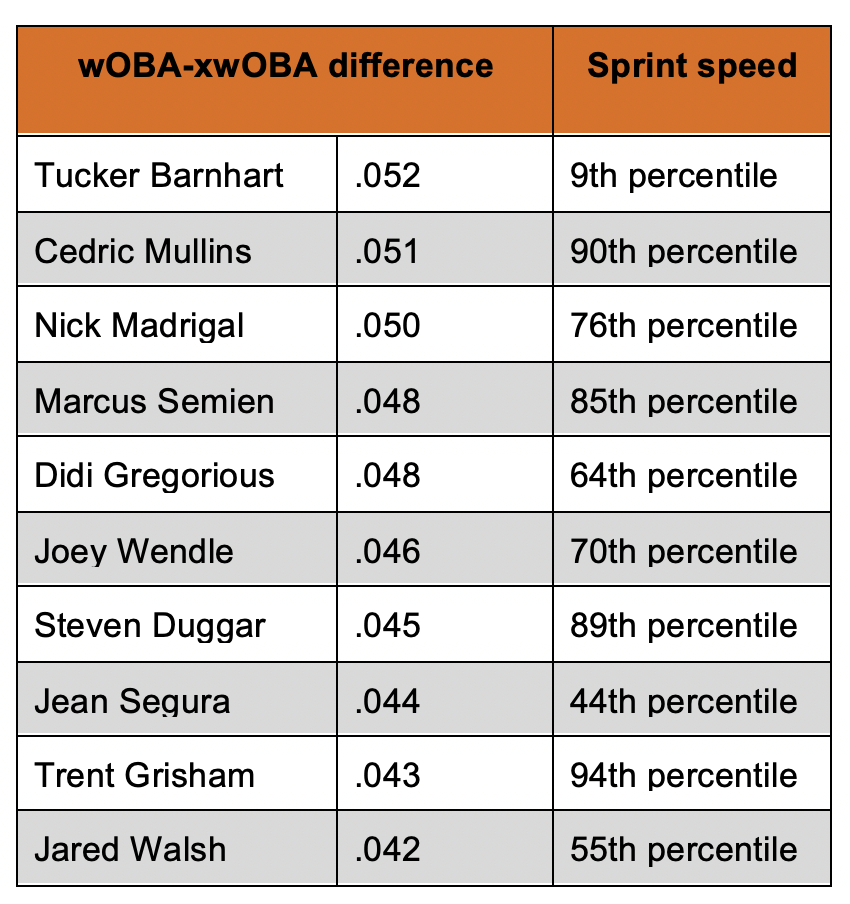
This proves that faster players are generally the ones that outperform their expected stats (put more simply: fast guys make stuff happen) because they’re often able and willing to take extra bases and beat out weak grounders or hits deep into the hole, something Mullins does often himself.
Next and lastly, let’s take a look at some of Mullins’ hits with the lowest xBA to determine whether these “lucky” base hits are just that, or if Mullins himself has a role to play in the outcome. To do this, I searched for his base hits this season with the lowest xBA and found eight hits with an xBA lower than .150. For the sake of time and brevity, I’ll narrow the list down to the five with the lowest xBA.
Hit 1: 4/02 vs. BOS
xBA: .100
Video: https://baseballsavant.mlb.com/sporty-videos?playId=34158035-afb0-48a2-9746-34e36e19ae5e
Mullins got his season off to a nice start with this leadoff single in his first plate appearance on Opening Day in Boston. Red Sox third baseman Rafael Devers is shifted slightly to the right side, something Mullins sees from opposing defenses often. On the fourth pitch of the game, he poked an inside 99 MPH fastball from Nathan Eovaldi down the third base line, forcing Devers to move to his right.
Hit just 56.5 mph to where the third baseman normally plays, this batted ball almost never results in a base hit. But, due to his speed, Devers doesn’t even attempt a throw to first, and Mullins reaches base with an infield single.
Mullins’ speed and opponent shifts playing a factor in these unexpected hits will be a common occurrence through the rest of this article.
Hit 2: 4/30 vs. OAK
xBA: .100
Video: https://baseballsavant.mlb.com/sporty-videos?playId=091ab96b-82d1-4618-ba5d-98d0f75d338c
Wrapping up the first month of the season, Mullins hit his fourth homer of the year in Oakland, a solo shot in an eventual O’s 3-2 win. This one was Mullins’ shortest home run of the season so far, going just a projected 355 feet as it snuck out just to the left of the right field foul pole.
Unlike the first example where Mullins used his speed to beat a shift and defy the odds, the O’s center fielder took advantage of a quirk in the Oakland Coliseum, leading to a home run that’s a fly ball out in almost every other MLB stadium.
Of the five Mullins base hits with the lowest xBA, this is the only home run and the first of only two extra base hits. You can probably guess what the other is.
Hit 3: 5/10 vs. BOS
xBA: .020
Video: https://baseballsavant.mlb.com/sporty-videos?playId=8c3af634-9be0-4691-85ec-93742e822341
In maybe the weirdest play of the MLB season, Mullins hit one of the shortest triples of all time in the 8th inning against Boston in early May. Mullins came into this at bat in a 4-for-his-last-23 slump with just one extra base hit in his previous five games.
Breaking the hit down, Mullins popped up a change-up into shallow left field, but Devers playing in for a bunt and shortstop Xander Bogaerts playing on the opposite side of second base made it a tough play from the start. Bogaerts reached where the ball landed and got a glove on it, but couldn’t reel it in and deflected it off himself twice before Devers eventually picked it up off the outfield grass. The best part is watching when Devers turns back to the infield, looks to second base figuring that’s where Mullins would be, then having to stop and turn mid-throw when realizing he was already halfway to third.
Like the first example hit, Mullins again takes advantage of a shift to get the pop up to drop for a hit and his speed to stretch it into a triple… with a little bit of luck going his way too (ok, maybe a lot of luck).
Hit 4: 6/06 vs. CLE
xBA: .100
Video: https://baseballsavant.mlb.com/sporty-videos?playId=f5fe3326-8c54-4ac5-8a35-36b56ca97649
You might remember this single in an Orioles’ 18-5 win over Cleveland. The day before, Mullins went 5-for-5 with two home runs, the first Oriole to do so since Cal Ripken Jr. in 1999. This single was Mullins’ second hit of the day, following up a first-inning home run to extend his hit streak to seven consecutive plate appearances.
There’s no crazy shift or super speed on display in this one. Mullins simply hit a fly ball into shallow center field that, according to Statcast, would be an out 90 percent of the time.
You could argue Harold Ramirez, the Indians’ center fielder on this play, was playing a little deeper than usual, but not too much. Ramirez has 90th percentile sprint speed as well as an 81st percentile outfielder jump, so his inability to get to this fly ball is a bit puzzling. Nonetheless, it dropped in for a single. When you’re hot like Mullins was this weekend, things like this just seem to go your way.
Hit 5: 6/29 vs. HOU
xBA: .150
Video: https://baseballsavant.mlb.com/sporty-videos?playId=38a5042b-1d76-4463-a78f-5d5e5b1939b7
Of the four we’ve looked at so far, this one is far and away the best showing of Mullins’ speed. All he does is turn on the jets to beat out a softly hit chopper to Astros first baseman Yuli Gurriel.
Not many other hitters are beating out this one, and it’s why players with speed like Mullins find themselves with the biggest difference between BA and xBA.
After looking at who surrounds Mullins on the leaderboards for biggest difference between expected stats and results and then taking a deeper look into some of Mullins luckiest base hits, we can see that he does in fact take advantage of opposing shifts and uses his speed to outperform what Statcast suggests his numbers should truly be, and that he is the exception to the rule that outperforming expected stats generally leads to a regression later in the season.
The Orioles’ All-Star is spraying the ball to all parts off the field better than he ever has. Here’s his spray chart so far in 2021 compared to his debut season as well as the one with the next most hits, 2018.

You can see the home runs are strictly coming from the pull side, but the opposite field power is still there. Almost half of his doubles have gone the opposite way.
He’s not only become less of a pull hitter, he’s also become one of the best hitters league wide against a shift.
His .344 wOBA against a shift is the best on the Orioles, and it’s 18th best in MLB among hitters who have been shifted against in at least 160 plate appearances. He ranks just behind sluggers like Yordan Alvarez, Jose Ramirez, Joey Gallo, Freddie Freeman and Matt Olson in that regard.
When I noticed the steep differences between Mullins’ expected numbers and results before I wrote this, I admit that I began to worry that he would soon come back down to earth. After all, the people behind Statcast are 100 times smarter than I’ll ever be. But after digging deeper into the reasons he has these differences, I not only understand expected stats better, but I also feel better about the outlook of Mullins’ season and beyond, and you should do too.


