With the Baltimore Orioles’ 2013 season now over we can now look back at the year that was for the team that finished 85-77, third in the American League East.
26 pitchers made an appearance for the Orioles in 2013, with 14 making at least one start. There were familiar names like Chris Tillman, Jim Johnson, Miguel Gonzalez, Wei-Yin Chen, Tommy Hunter, and Darren O’Day. If you blinked you might have missed Zach Clark, Alex Burnett, Mike Belfiore, Luis Ayala, or Jairo Asencio on the hill.
In total, Orioles pitchers threw 23,792 pitches over 1,453 innings. Some were good, others were bad. Some were fast, some slow. But whose pitches were the “best”?
Thanks to pitch data compiled by the indispensable Fan Graphs and Brooks Baseball when have a pretty good idea.
Fan Graphs uses a weight system to determine the effectiveness of pitch types on a “per 100 pitch” basis that attempts to determine how many runs a pitcher saved using a particular pitch and has a normal range of +1.5 to -1.5, with zero considered average. Based on this, here’s how the “best” pitches on the Orioles staff this season shake out.
I set the minimum innings limit at 50, causing Kevin Gausman (47.2) and Zach Britton (40) to miss the cut, while Brian Matusz (51) and Bud Norris (50.2) barely made it.
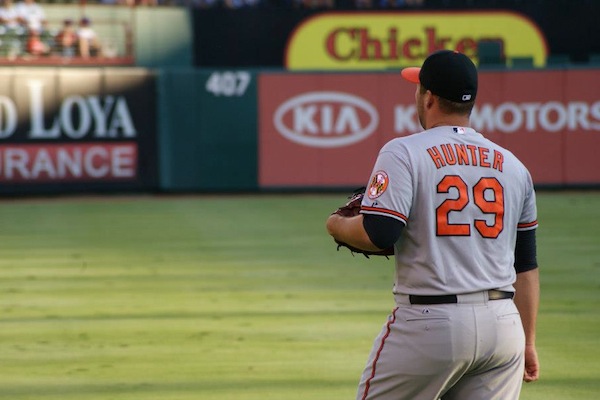
As probably expected, Tommy Hunter had the Orioles’ most effective fastball, which he threw 703 times with an average velocity of 97 mph. Hunter used it to register 33 strikeouts and opposing batters mustered a mere .183 batting average and .280 slugging percentage against it. Of the five different pitches he threw this season his fastball was hit for a line drive just 3.27% of the time, the lowest of the five.
The race for best slider was razor thin with Brian Matusz’s coming in at 1.72, closely followed by Bud Norris (1.71) and Darren O’Day (1.70). Matusz used his slider 233 times with (not surprisingly) 180 of them coming against left-handed hitters. It generated swing & misses 19.74% of the time and caused 16 batters to strike out. Of the 14 hits Matusz allowed on that pitch, 10 were singles and the opposition hit just .209 against it.
Hunter makes another appearance for his second most-used pitch, his cutter. Used 241 times, it generated Hunter’s highest swing & miss percentage (15.77%) and second highest ground ball percentage (9.54%). Of the three pitches he used more than 200 times it was the only one to yield fewer than three home runs.
The weight of Matusz’s curveball was largely due to smaller usage (just 43 pitches), but extremely high effectiveness. He didn’t allow a single hit or walk with it all year. Chen was next on the list, which is somewhat ironic considering that of the five pitches he used this year his curve was the pitch he utilized the least (178 times). When he did, it was a strike 34.27% of the time (highest of any of his pitches) and put in play the least of any pitch he used at 12.36%.
Changeups were largely not a pitch that generated positive results for the Orioles in 2013. Only Chen’s was positively weighted, barely above zero. With an average speed of 84 mph it produced ground balls at a 13.46% clip and was the only pitch Chen used that wasn’t hit for a home run, despite being thrown 260 times.
Gonzalez pretty comfortably had the best split-finger pitch, which he used 533 times. Of his six pitches it was the one swung at the most (53.28%), but produced just a .205 batting average against despite being put in play more than any pitch he threw (21.01%). It also resulted in Gonzalez’s highest whiff percentage at 16.51%.
About what you expected to see or did anyone surprise you? Since the names mentioned for the six pitch types above figure to be back with the club it will in interesting to see if there is any shifting in the rankings next year.
Follow me on Twitter @GDixon410.

