submitted by Michael Vetter
In my last blog post, I mentioned that I was not very happy with some of Fangraphs’ projections, especially because they assumed that Chris Davis would be playing more first base for the O’s in 2021 than Trey Mancini. Well, Fangraphs must have read what I said, because they now project Mancini to have more plate appearances at 1B than The Artist Formerly Known as Crush, with Ryan Mountcastle as the main First Baseman. Their projections also now have Mancini as the full-time DH, which would help the O’s to win more games via improved outfield defense. Even though Fangraphs has improved their projections from that perspective, there are still some significant opportunities for the Orioles to beat out Fangraphs’ projections and finish with more than the 66 wins that they are predicted to achieve.

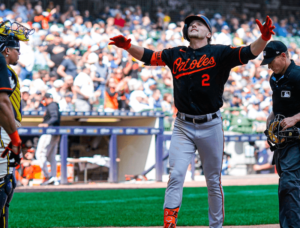
A great way to illustrate these opportunities is by comparing the 2021 Fangraphs’ projections to the three most recognizable Orioles’ past performances. First, Anthony Santander is only projected for a WAR of 1.7 in 2021, despite the fact that he had a 0.9 WAR in only 165 plate appearances in 2020. It is reasonable to expect Santander to have 600 plate appearances in a full season, which would lead to an annualized 2020 WAR of 3.3. This would be an impressive, yet realistic number, especially since his 2020 stats do not seem to be an anomaly. Baseball Savant states that his xwOBA was only eight points lower than his actual wOBA and that he was well above league average in xwOBA, xSLG, Barrel %, and K % in 2020. So, if Santander performs at his repeatable 2020 levels in 2021 to get to a WAR of 3.3, he should add at least 1.5 wins to the 2021 Orioles’ projected total from Fangraphs.
Related: What Could Santander Fetch in a Trade?
Next, Mancini’s 2021 projected WAR via Fangraphs is only 1.4. I understand why Fangraphs projected such a low amount, due to his strenuous physical recovery that has been well-documented and discussed at Eutaw Street Report.
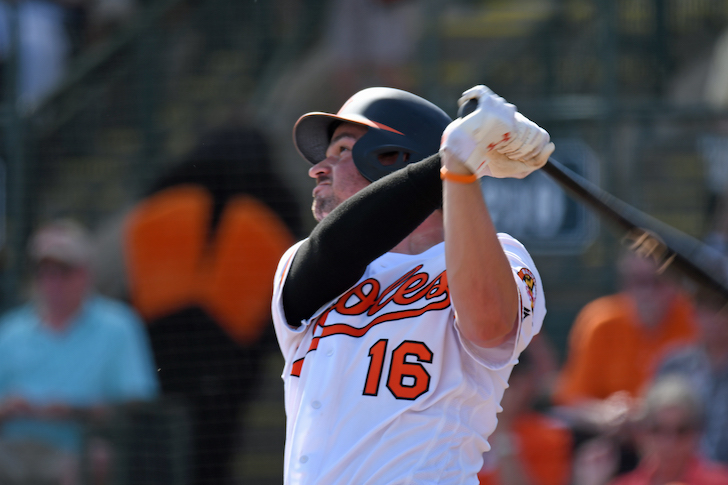
On the other hand, Mancini’s WAR in 2019 was an exemplary 3.7; it could have been even higher if less than 62% of Trey’s defensive innings were in the outfield, which is certainly not his strength. He is still in his prime years at the ripe age of 29, and he did say “In every standpoint of the game, I really do feel just like I did before.” It may seem naive to take Mancini at his word, but if it is even close to true, then there is some real hope for him to reach his 2019 performance levels in 2021. His 2019 performance was sustainable, as his wOBA was merely .012 higher than his xWOBA, according to Baseball Savant. Similarly to Santander, that site illustrates that Trey was above average in Exit Velocity, Hard Hit %, xwOBA, xSLG, Barrel %, K%, and BB %. This is because Trey truly matured mentally in 2019 and took his game to a new level. Baseball is most definitely a high-level sport and his physical state is important, but what separates the greatest MLB players from the others is their mental approaches. As Trey plays more DH and 1B in 2021, while coming back with the same mentality, he could reach his 2019 performance levels and add at least two wins to what Fangraphs predicts in 2021 for the O’s.
Finally, Fangraphs would have us believe that John Means will only have a WAR of 1.7 in 2021. To me, this is the most astounding of the projections that I am documenting in this post. Means had a WAR of 3.0 in 2019 when he was only in his first full season and I fully expect him to reach and surpass those heights in 2021 as a veteran. I know that Means only had an annualized WAR of about 1.0 in 2020, but we need to dive further into the underlying statistics behind that performance. Again, I am referencing Baseball Savant, which reveals that while his 2019 opposing xwOBA was only six points higher than the actual wOBA, his 2020 opposing xWOBA was a whole 36 points lower than the opposing wOBA that resulted. Not only that, but Means’s 2020 xwOBA of .268 was .033 lower than the actual wOBA in 2019 of .295.
This makes sense, because Savant demonstrates that John was above league average in xERA, xBA, xSLG, K %, BB % (95th percentile!), Fastball Velocity, and Fastball Spin Rate. He did regress in opponent Exit Velocity and Hard Hit %, but this was mostly due to bad performances in his first five starts within a highly unusual season.
To me, these numbers truly don’t lie and they demonstrate that John can replicate his 2019 season and even improve upon it. I don’t see any reason, other than injury, that would stop Means from finishing with a WAR that is at least 1.5 wins above Fangraphs’ projection of 1.7 (Also, don’t forget about his new dad strength).
Projections are certainly never sure bets, and it is very possible that either Fangraphs is wrong, I am wrong about Santander, Means, and Mancini, or we are both wrong and Chris Davis starts all 162 games at 1B to clinch another top five pick for the Orioles. Still, I think that the stats that I have projected should bring some real hope to O’s fans for the team’s top three stars to really stand out and add about five wins to Fangraphs’ projections, which would result in 71 wins for the 2021 Orioles.
There are also opportunities for this team to earn more wins by calling up prospects (e.g. Adley Rutschman) earlier than expected, developing Dean Kremer, Keegan Akin, and Bruce Zimmermann to round out the rotation, and continuing the success that the bullpen found in 2020. We have a lot to look forward to this year as O’s fans and I am just hoping that we can all make it to a game while staying safe.
Let’s hope that the three stars can carry this team to greater relevance, and maybe even earn the Orioles multiple All-Stars in 2021.

